Plots with ROOTs Plots with ROOTs
Data visualization with gnuplot | Learn to build figures you can understand, change and share.
Plain text.
Clear figures.
Lasting skills.
Turn Titanic passenger and crew data into plots you can explain and rebuild. Start with a table, write a few commands, and learn what each visual choice does.
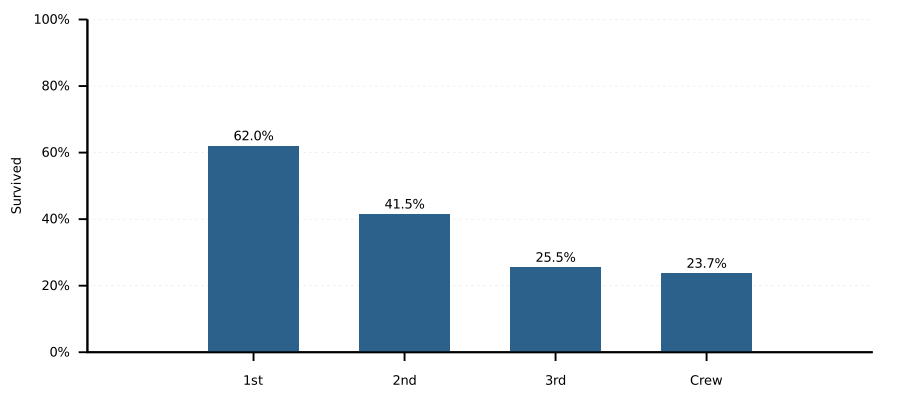
data → script → figure
Readable at every step.
Choose your way in.
Same data. Same plotting ideas. Your preferred tools.
The dataset
Trace the provenance, inspect the embedded records, and reproduce every shared CSV table from one Org source.
Explore the dataset → 02 · Explore & documentIn an Org notebook
Keep prose, tables, code and figures together. Work through the examples with Emacs and Org Babel.
Open the live notebook → 03 · Write & runIn the terminal
Retrieve ready-made CSVs from Zenodo, inspect them, write a .gp file in an editor, and run it with gnuplot. Works with Bash and Git Bash.
Open the terminal lesson → 04 · Look up & understandThe student reference
Find a command, read what it means, and see it in a Titanic plot. Numbered listings make examples easy to locate.
Explore the reference → 05 · Change & explainStudent challenges
Try 26 short tasks, from the independent introduction to the Titanic chapters. Adapt a plot, check the data and explain your visual choices, in either environment.
Open the exercise sheet →Go beyond the first bar chart.
Browse all 18 plots →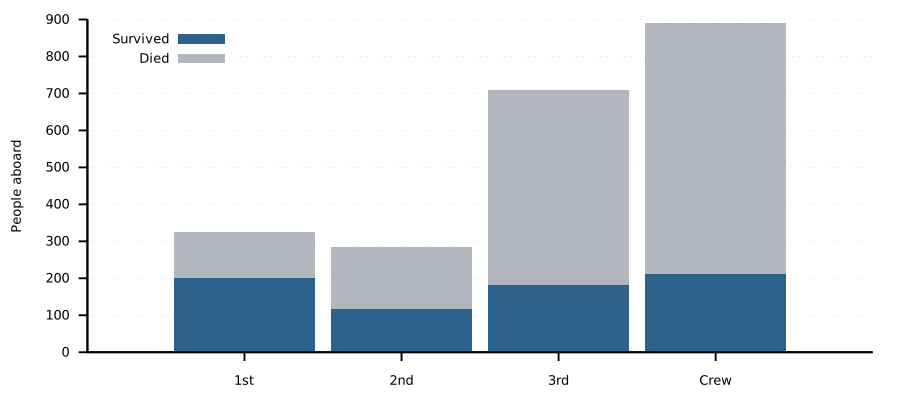
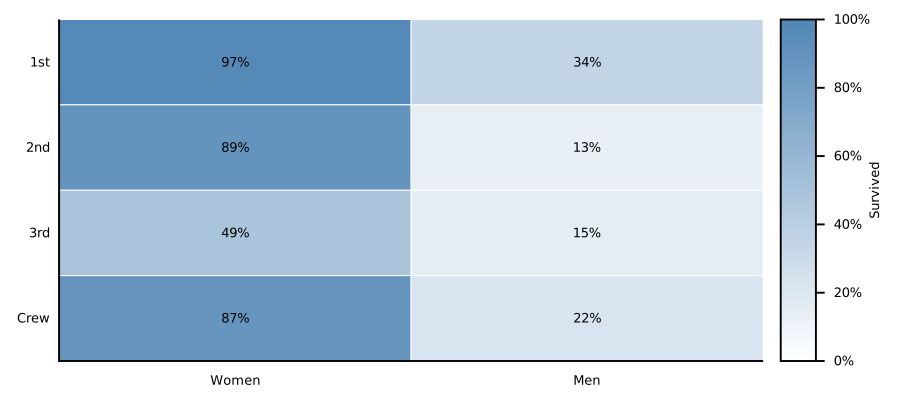
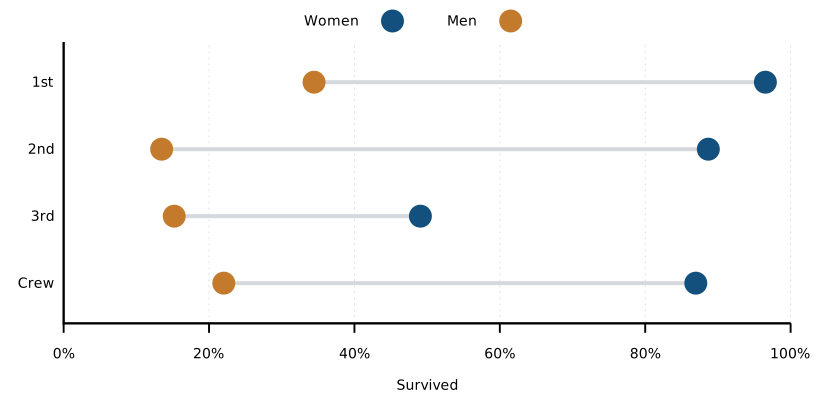
Tools with ROOTs.
Open the slides →Inspect the steps and understand what went wrong.
Read, share and adapt the scripts and data.
Keep the workflow understandable for the next person.
Build on established, plain-text tools.
Further reading
- Philipp K. Janert, Gnuplot in Action, Second Edition (Manning, 2016). Optional book on plotting and understanding data.
- Org Babel gnuplot tutorial. Worked examples with functions and named tables; some setup and output advice is historical.
- Plotting tables with org-plot. Examples and options for
#+PLOT:directives above Org tables.